 Transpose
The Transpose function is used for geometrical transformation of Excel tables (transposition), where rows will form columns and columns will form rows.
Properties
| Include Header |
Boolean. Property defines whether the table header will be included in transposition. If FALSE, the table header will be ignored. |
| Create New Header |
Boolean. Property defines whether new variable names (column names) will be defined by selected variable (column). If FALSE, new names will be formed by the "Var_" string with order number postfix (Var_1, Var_2, …, Var_n).
|
Keywords
Transpose Excel Table, Rows to Columns, Columns to Rows, Transpose Matrix in Excel, Transpose Data in Excel, Horizontal to Vertical, Vertical to Horizontal, Excel Transpose,Transpose Rows to Columns, Switch Columns to Rows
See Also
Flip_Horizontal,
Flip_Vertical,
Gather,
Spread
Video-tutorial
How to Transpose Excel Table
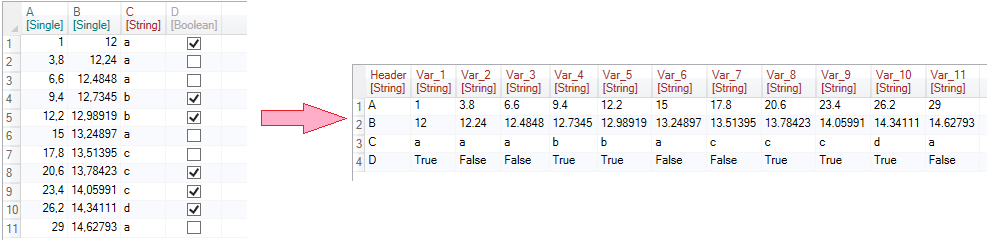
With the Transpose function, you can "geometrically" transform your Excel tables. With this function, you can convert columns to rows and rows to columns - transpose. The example is shown in the following figure.
With the need for this transformation I often encounter, for example, when I work with chemical analyzes - I get them in the form where the individual analyzes are listed in columns and the values of individual chemical components are listed in rows. This table form is easier to read for a small number of analyzes. On the other hand, if you want to continue working with these data, they need to be transposed - analyzes should be made up of individual rows and component measurements should be in individual columns.
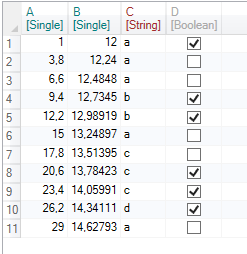
In our example, we use the following table with 4 variables (columns) and 11 records (rows).
If you want to transpose this table, click on the Transpose button in the ribbon toolbar tab Reshape.

Subsequently, the function is added to the list of applied functions in the side panel. If you click on the Transpose function, the parameters Include Header and Create New Header appear in the Properties Panel.
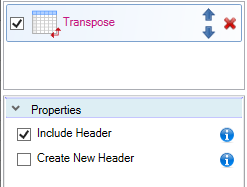
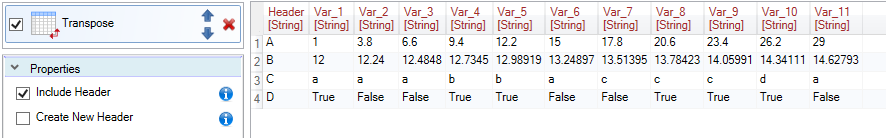
By setting these parameters you can get 4 slightly different results. By default, the Include Header property is set to TRUE. With this setup, column names of input table (A to D) will be displayed in first column of the new table. The other columns are created from the values that formed the content of input dataset.
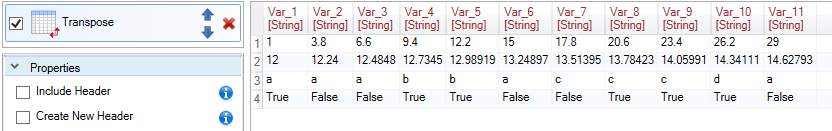
If you set this property to FALSE, only table values will be included to the table transposition - the first column (containing variable names) will not be created.
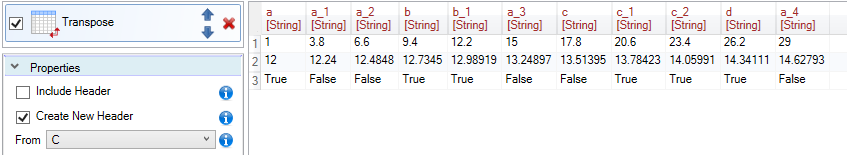
Another option is to set the Create New Header property to TRUE. Ather this change, you will see a new combo-box From, where you select a variable (column) whose values will be used as the names of the new table header. In the following example, we chose the C variable that contains string values. If these values are not unique, the program automatically adds the postfix values "_" together with the order number to the individual names.
In the result, the transposed table contains one line less, because values of selected variable was used as the names of the new table columns. Because the resulting columns contain values with different data types, they were automatically converted to universal string types. If the table contains variables with the same data types (e.g. double), the program leaves new variables in the same data type.
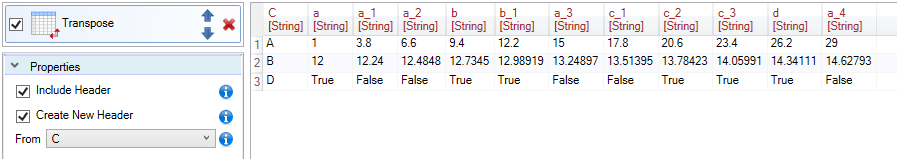
Finally, we’ll get the last combination of settings if we set both properties to TRUE. In this case, the variable names from the input table are inserted into the first column of the new table, and values from the selected column (variable C) are applied as the header names of the new table.
The Transpose function serves to quick and effective transposition of Excel tables and matrix structures. Its execution is fast and the settings are easy to understand.
�