 Filter
Function selects rows that fits typed filter condition.
Properties
| Conditions |
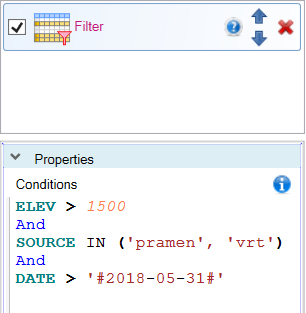
Logical predicates defined in terms of the dates variables. Multiple conditions are combined with And / Or commands. Only rows where the condition evaluates to TRUE are kept.
|
Keywords
filter, filter excel rows by conditions, filter, conditional filters, Excel table
See Also
Filter_At,
Distinct,
Slice
How to Filter Rows in Excel Tables
Data filtering is one of the most important data processing tasks. We use filtering to remove the selected type of records, e.g. wrong records or records with missing data. The second case of filtering is to select part of the large dataset we need for the following analysis - to select small part from the large dataset.
For Excel data, multiple functions can be used in the Reshape.XL add-in. The basic function is Filter. You can use this feature to create specific filters to apply to your dataset. In the following, we will describe the options that the Filter function offers. We will also show you how to combine it with the Group function for specific summary filters.

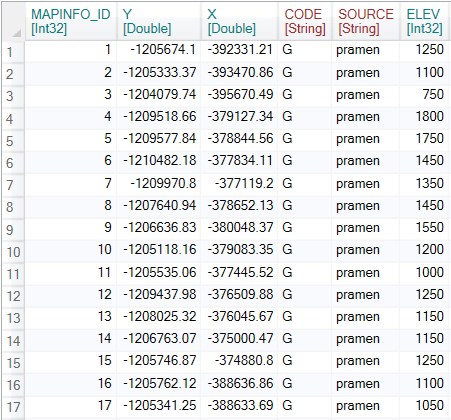
For the following text we will use a larger dataset that contains a number of text and numeric variables (columns). Part of this dataset is shown in the following figure.
To filter the data, click on the Filter button in the ribbon toolbar tab Subset.

After clicking on the button described, the Filter function appears in the Side panel. If you click on it, you can see its options. The Filter function contains only one adjustable parameter - Conditions. In the Conditions editor, you define a function (or several associated functions) that filter our data. The editor has built-in strong support for autocomplete and syntax highlighting. The filter definition is therefore simple, fast and readable. After defining the filter, just click on the Run button and the filter will be automatically applied to the input dataset.
For the filter definitions, we use the so-called Formula Expressions that allow you to define formulas within selected Functions such as Filter or Mutate. Expressions are strongly inspired by SQL language functions, so their understanding is relatively simple and fast. Complete description of Formula Expressions can be found here.
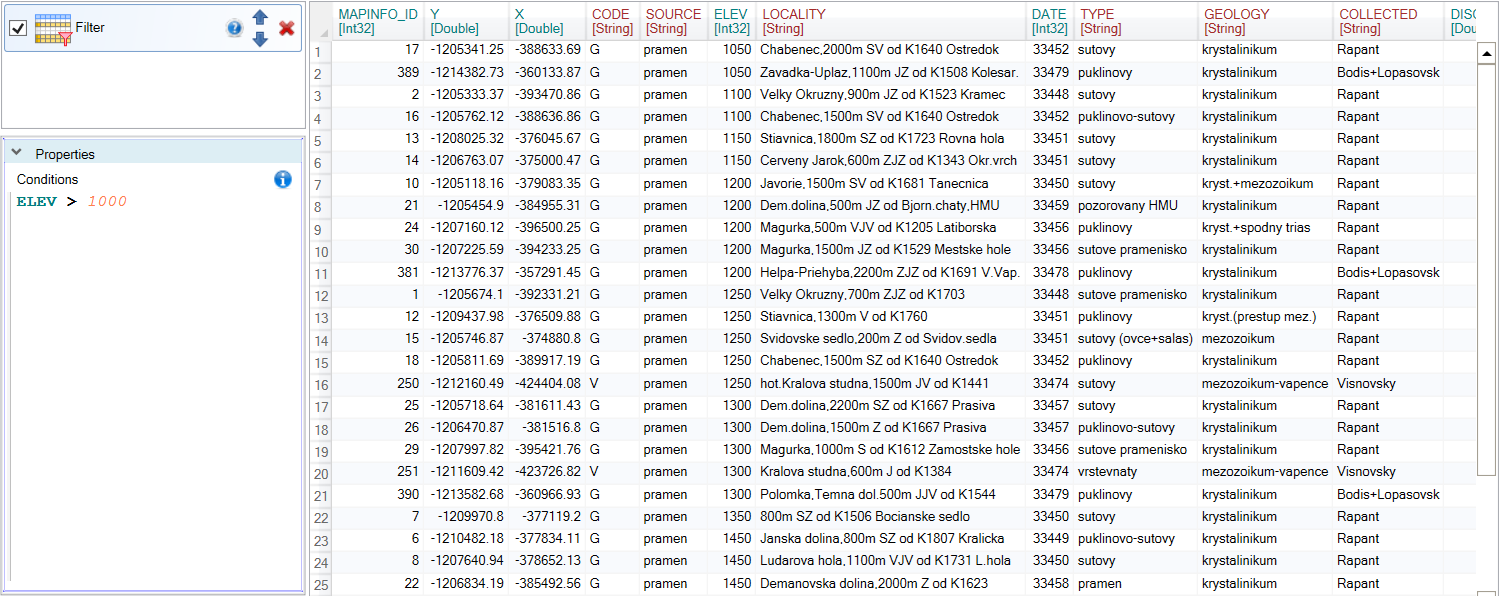
In the first example, we apply a very simple filter type to the dataset. With the “ELEV >1000” formula we select from the table records where the value of the ELEV variable (column) is higher than 1000.
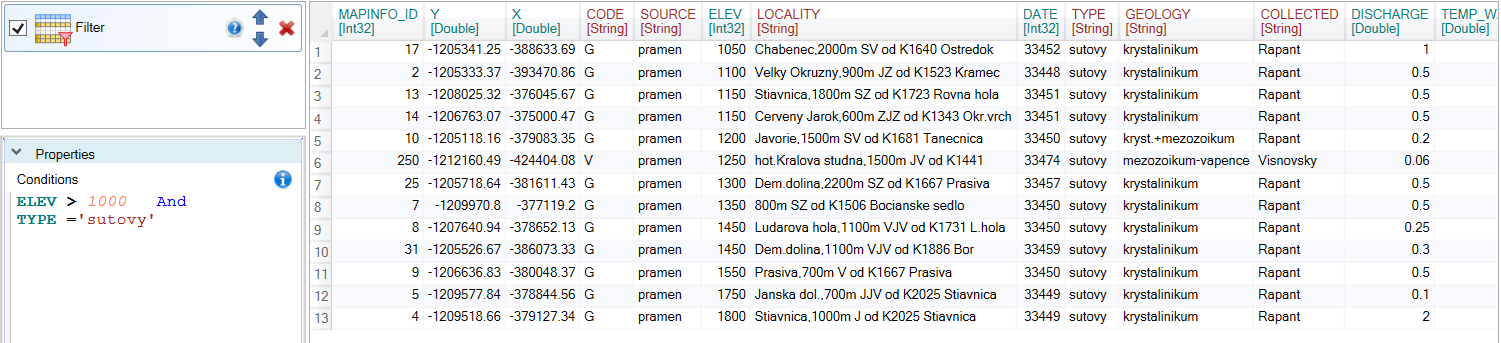
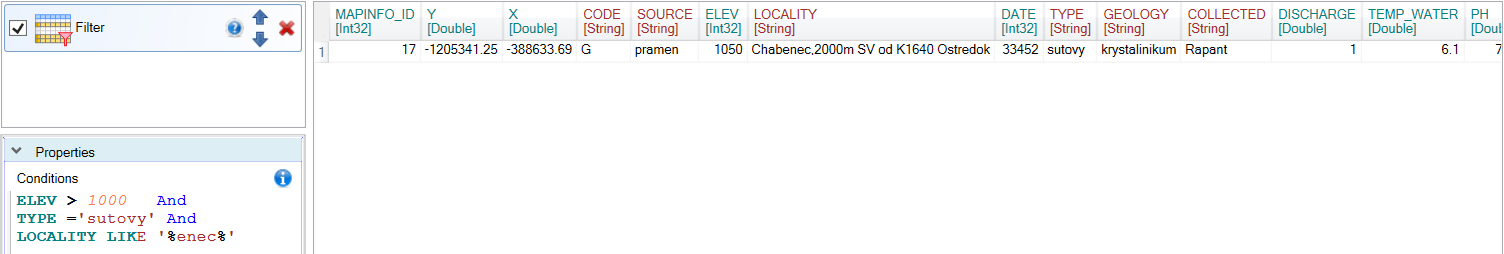
In the next example, we want to create a more complex filter type. We want to select records (rows) where the value of the ELEV variable is higher than 1000 and the variable TYPE is equal to string “sutinovy”. We combine these two filters using the And operator. In the case of string parameters, we enclose these in simple single quotes. If you would like to create a filter in which only one condition must be met, we will connect the filters using the Or operator. As we can see in the following figure, only 13 records from the large dataset fits these two conditions.
The filter can be refilled as needed. In the following example, we selected records that contained “enec” string in the LOCALITY variable. We achieved this with the LIKE ‘%enec%’ formula. To learn more about these features, you can read the definition of Reshape.XL Formula Expressions. As a result, we get only one row that met the required conditions.
You can use any number of combined conditions to define filters. For example, you could create a condition where the data meets a set of two conditions, or a set of other two conditions. In this case, the following simplified formula can be used:
(filter_1 AND filter_2) OR (filter_3 AND filter_4)
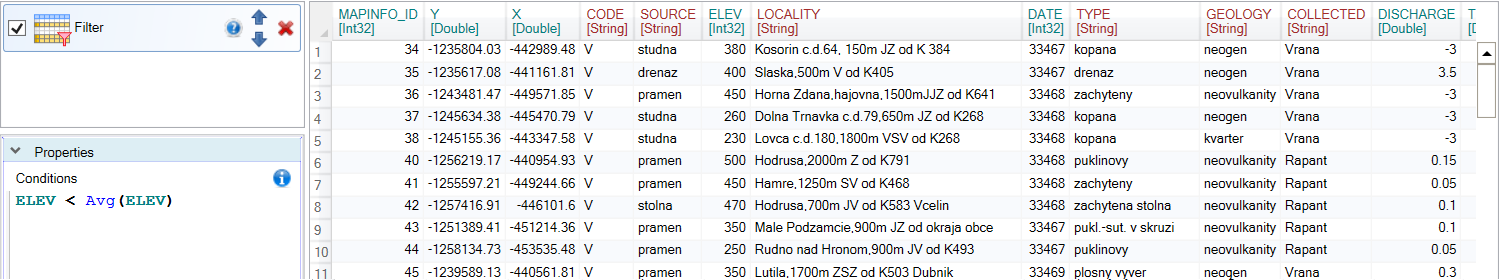
In addition to basic - simple filters, you can also use summary filters. For these filters, we use summary functions such as Sum, Min, Max, Avg or StDev. The following filter shows the use of the Avg summary function. In this case, we filter table rows where the ELEV variable is lower than the average value for the entire dataset.
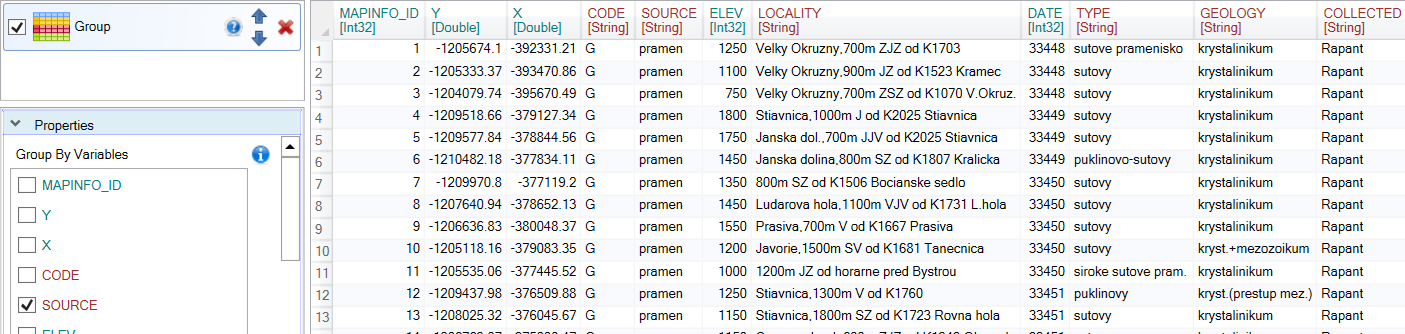
Summing functions can be also applied to groups of records within the dataset. You must only create groups in the data. These sub-tables are created using the Group function. In the Group function properties select one or more variables (most often categorical variables) to group the dataset. In our case, we have divided the dataset according to the categorical variable SOURCE.
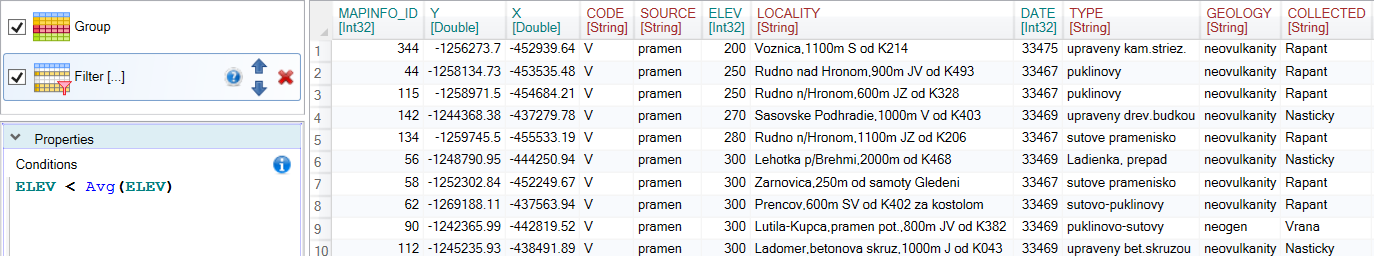
To grouped dataset we apply the Filter function. In Conditions we define a filter using the summing function Avg. If the dataset is grouped into separate sub-tables, the Avg(ELEV) formula will be calculated individually for each group. The values from the ELEV variable will then be compared with the average values calculated for each group individually.
Using the Filter function is very easy and fast. You can also define advanced filter types with a combination of summarization functions, Formula Expressions and grouping features. In addition to the basic Filter function, Reshape.XL also includes many other features for even faster and easier data filtering such as Filter_At, Filter_Between or Filter_Starts_With.
For a complete understanding I suggest you take a look at the Formula Expressions. These expressions are used in several core functions and complements the add-in capabilities.