 Distinct
Function selects only unique (distinct) rows from an input table - removes duplicate data.
Properties
| Select Variables |
Selected variables (table columns) that will be used when determining uniqueness. In the case of non-unique rows, only the first row will be preserved. If no variable is selected, program will use all table variables. |
| Keep All |
Boolean. If TRUE, all variables (columns) will be preserved in result dataset. If FALSE, only selected variables remains in the result dataset. |
Keywords
distinct, distinct alternative in Excel, unique excel rows, select unique, select distinct, excel, spreadsheet table, select unique, select distinct, remove duplicated, duplicated combinations, filter for unique values
See Also
Filter,
Sample,
First_N
Video-tutorial
How to Select Distinct / Unique Values in Excel Tables
A common task when working with data is to obtain unique values or unique combinations of values in selected variables - columns of the table. We often use this feature to analyze an input dataset that contains several categorical variables. An example of unique (distinct) values selection is shown in the following figure. Within the Reshape.XL add-in, we use the Distinct function to select unique values. In the following text, this function with all its options is described.
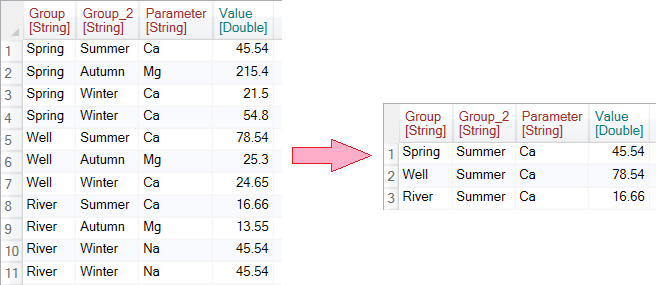
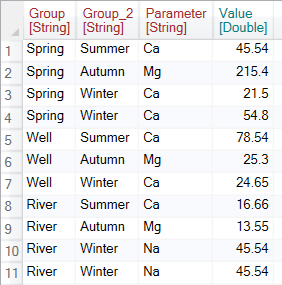
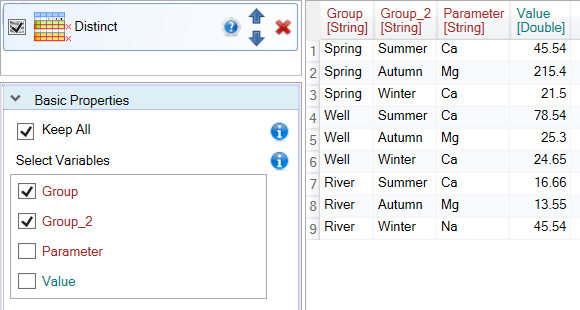
As an input dataset we use a relatively simple table that contains three categorical variables - Group, Group_2 and Parameter and one numeric variable - Value.
To select unique column values from this dataset, click the Distinct button in the ribbon toolbar tab Subset.

The function is displayed in the Side panel. If you click on it, its adjustable parameters will appear at the bottom of the Side panel. Overall, the function contains two definable parameters - Keep All and Select Variables.
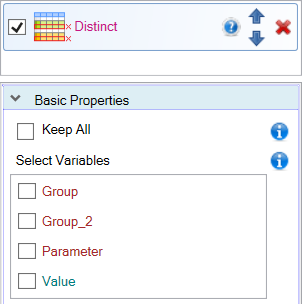
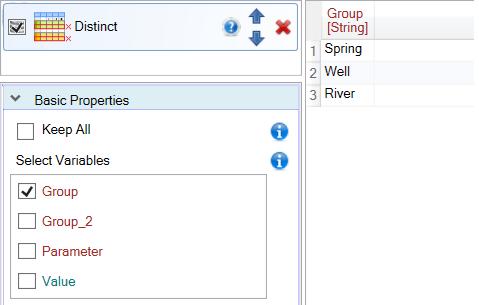
Use the Select Variables parameter to define variables in which you want to select unique values. In the following example, we looked for distinct values in the Group variable. As a result, a table containing only one Group variable was displayed, and this variable displays three unique values that occurred in the input dataset - Spring, Well and River.
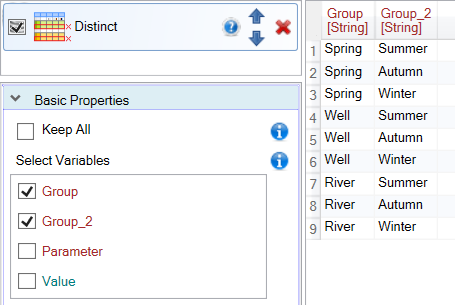
If you want to search for unique combinations of several variables (columns), we set their check-boxes to TRUE. In the following example, we searched for unique combinations within two variables - Group and Group_2.
In previous examples, we have always obtained only values for the variables in which we searched unique values. To keep other columns in the resulting table, set the Keep All property to TRUE. In this case, the program looks for unique values in the selected variables and also selects the first values in the order for other (unused) variables.
An example is shown in the following figure. The program was looking for unique combinations for the Group and Group_2 columns. If found, he added to the other columns the values from the first record in the order that contained the current combination of unique values (Group and Group_2).
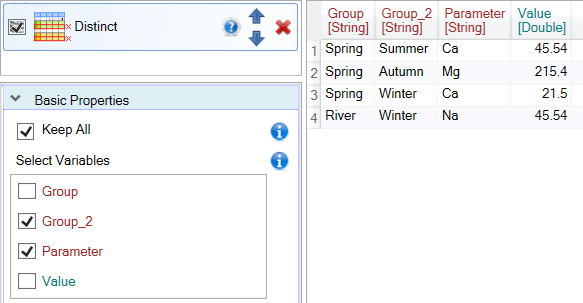
If we select a combination of other variables, the character of result table (the number of rows) will change. An example is shown in the following image, where we get unique records by the Group_2 and Parameter columns.
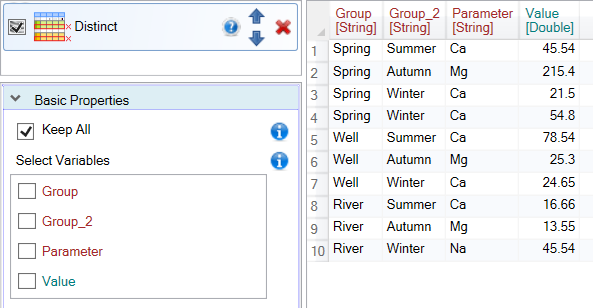
Finally, the last option is to search for unique rows - records where the combination of all values in the row is unique. This type of distinct records is obtained if you select all the variables in the Select Variable property, or vice versa if you do not select a single variable. The result will be the same for both settings.
Finding and selecting unique (distinct) rows in Excel tables is very easy and fast with the Reshape.XL add-in. Other functions from the Subset group that are interesting are Filter, Sample or First_N.