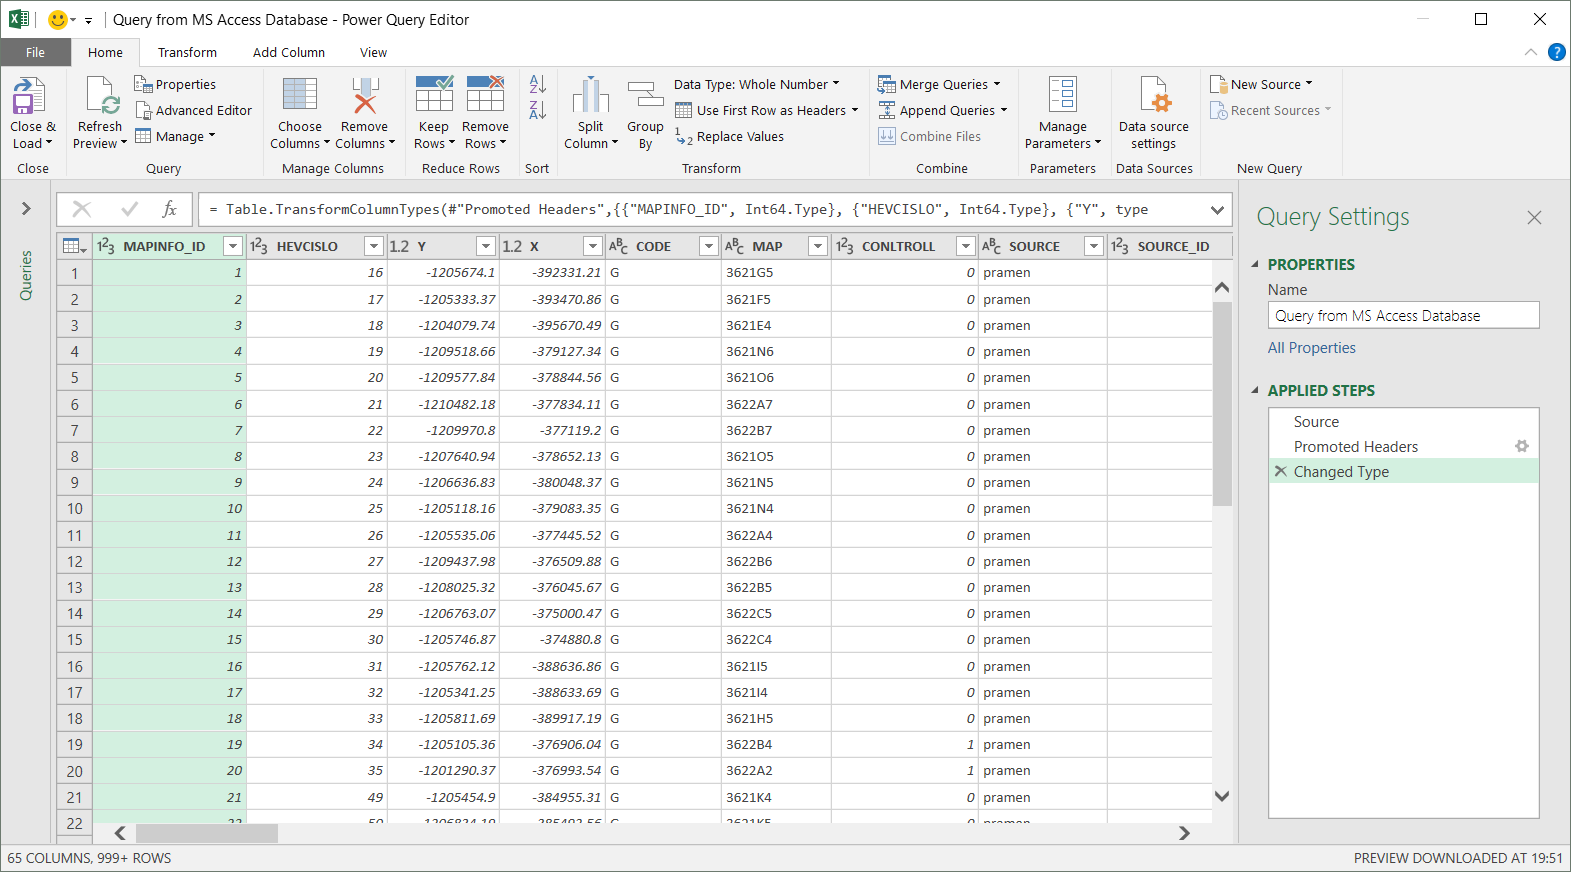
Add-in Power Query is a comprehensive tool that has been created for tasks where basic Excel functionality is not enough. Power Query is a tool for connecting to variable data sources, data cleaning, processing and combining. Its architecture and workflow is influenced by Excel and similar tools from Microsoft. Its main advantage is that it is distributed free of charge and on the Internet you will find a number of tutorials for its use.
The Reshape.XL add-in focuses on processing of data already loaded in Excel spreadsheet - on data wrangling. You select the data in Excel spreadsheet and import them into the add-in. Then you work with them.
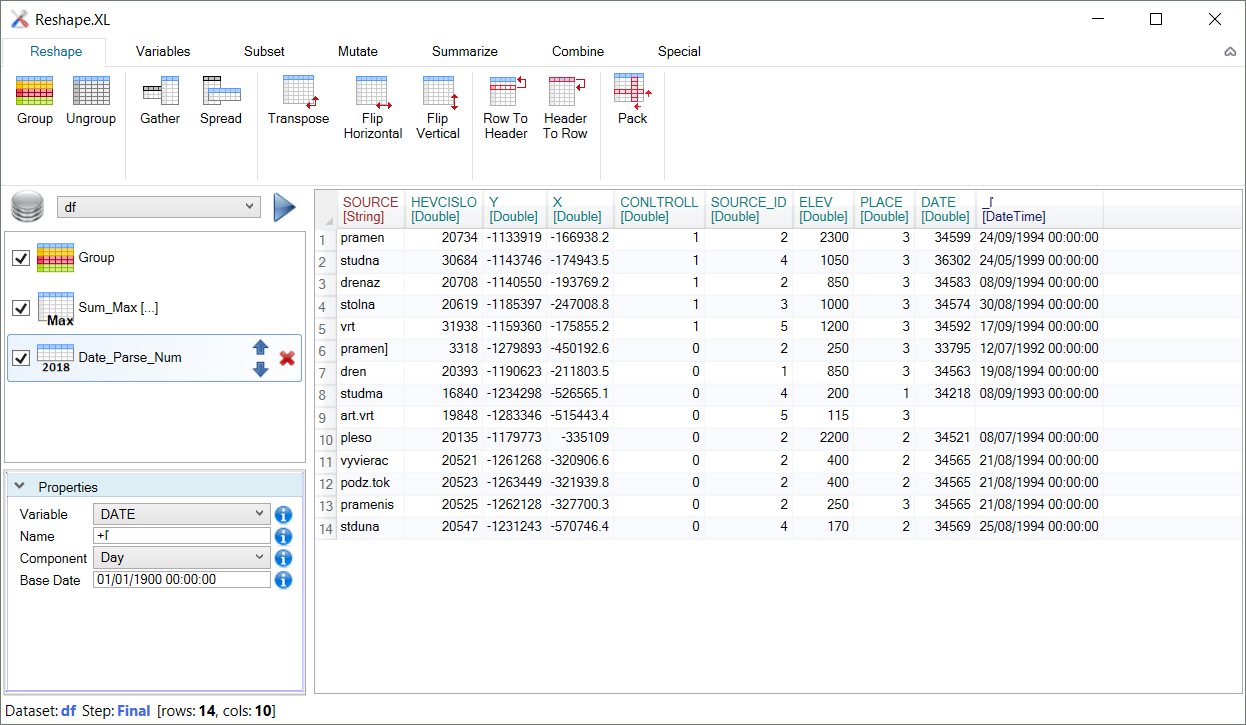
Reshape.XL architecture is much simpler and more straightforward than in the Power Query. Basically, you can fully use this add-in after watching one basic 10-minute video tutorial. The program is divided into three parts. The main part is a table showing the current status of the dataset in the processing process.
The functions you want to apply can be found in the ribbon toolbar: This toolbar is logically divided into 7 tabs. Each tab contains several functions that have a similar character - for example general purpose functions for work with dataset columns (tab Variables), table rows selection (tab Subset), creation of new variables (tab Mutate), statistical summarization of data (tab Summarize) or datasets joining (tab Combine).
The add-in does not contain a number of help dialogs and shares simple logic of data processing definition across all available functions. When you click on a function in the ribbon toolbar, it appears in the Side Panel. If you click on a selected function, its settings will appear at the bottom part of the Side Panel. Here you set them and click the Run button. The result is displayed again in the table.
In addition to the current processing status of the dataset, you can also display data after any processing step. For this purpose, simply double-click on the selected step - a function in the Side Panel.
The add-in is strongly inspired by up-to-date data science tools like SQL and R (Tidyr and dplyr packages). The expressiveness of each function is robust as in SQL, and the workflow with data is identical to the principle of R packages from the Tidyverse group. The difference with the described tools is that you do not perform data processing through code and scripts, but through a very simple and fast visual interface.
So if your daily task is to process Excel data - cleaning, editing, selection, combining and summarizing - I suggest you try this tool. It can save you hundreds of hours of manual boring work that you can use to evaluate the results of your data processing. Likewise, the Reshape.XL add-in is useful if you looking for an alternative to Power Query. You don’t have to leave the familiar Excel environment and learn to use brand new software.