Reshape.XL User Interface
This chapter introduces Reshape.XL add-in interface. You will learn about the visual layout of add-in, about the data wrangling workflow and functionality. Individual data wrangling functions are presented here.
Add-in Layout
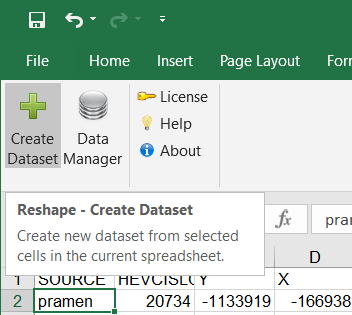
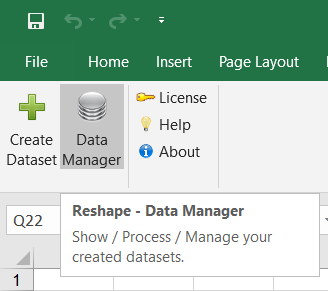
After running Excel, you can see the Reshape toolbar tab. Behind this very simple toolbar is hidden complete functionality of the add-in. In the toolbar you can see five buttons. The last three buttons (License, Help, About) represents support features - license activation, view the documentation and add-in “about dialog" display.
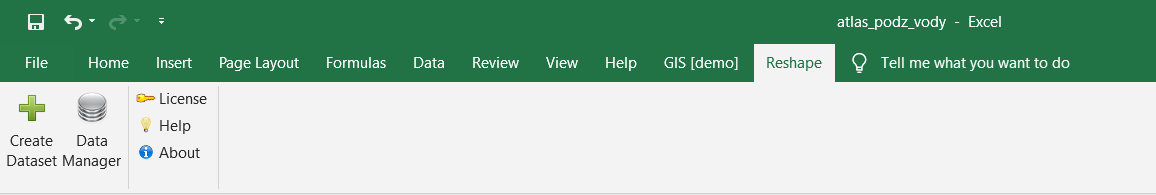
For actual data wrangling work you use the first two buttons - Create Dataset and Data Manager. With the Create Dataset button you can create new dataset that will be processed in the Reshape.XL add-in. With individual datasets you can work from the Data Manager Panel. This panel is displayed if you press the Data Manager button.
In this panel are listed individual datasets that you create from data selected in Excel spreadsheets. Reshape.XL is created as the “Application Level" add-in and Data Manager panels in individual Excel windows are synchronized. Thanks to this fact you can use add-in for data processing across spreadsheets / Excel files.
Individual datasets listed in the Data Manager Panel can be processed and combined in the Reshape.XL Main Window. This window is displayed if you press the Reshape.XL icon in the Data Manager or after the double-click on selected dataset. All the data wrangling functions you can apply to your datasets through this window.
Prior to data wrangling, you need to create datasets from your spreadsheets data. The following chapter focuses on this process.
Create Dataset
Producing datasets from your spreadsheets data is very simple process. In the first step it is necessary to select the data in spreadsheet. You have three options for data selection. You can select your data exactly by mouse. Exact selection is the fastest option for input data processing. You can select data by mouse or by your keyboard.
In the case, you can import large dataset - large number of rows or columns, you can select whole rows or columns by clicking on the row / column headers. Selection of the entire spreadsheet is not allowed. Minimal size of dataset is 1 row + 2 columns or 2 rows + 1 column. Your selection may include variable / column names.
Info: In the add-in (and in documentation) individual columns are terminologically defined as Variables and rows as Records.
In the case of missing variable names these are automatically generated in the form of simple string “Var_" and number postfix (e.g. Var_1, Var_2, Var_3, … Var_n).
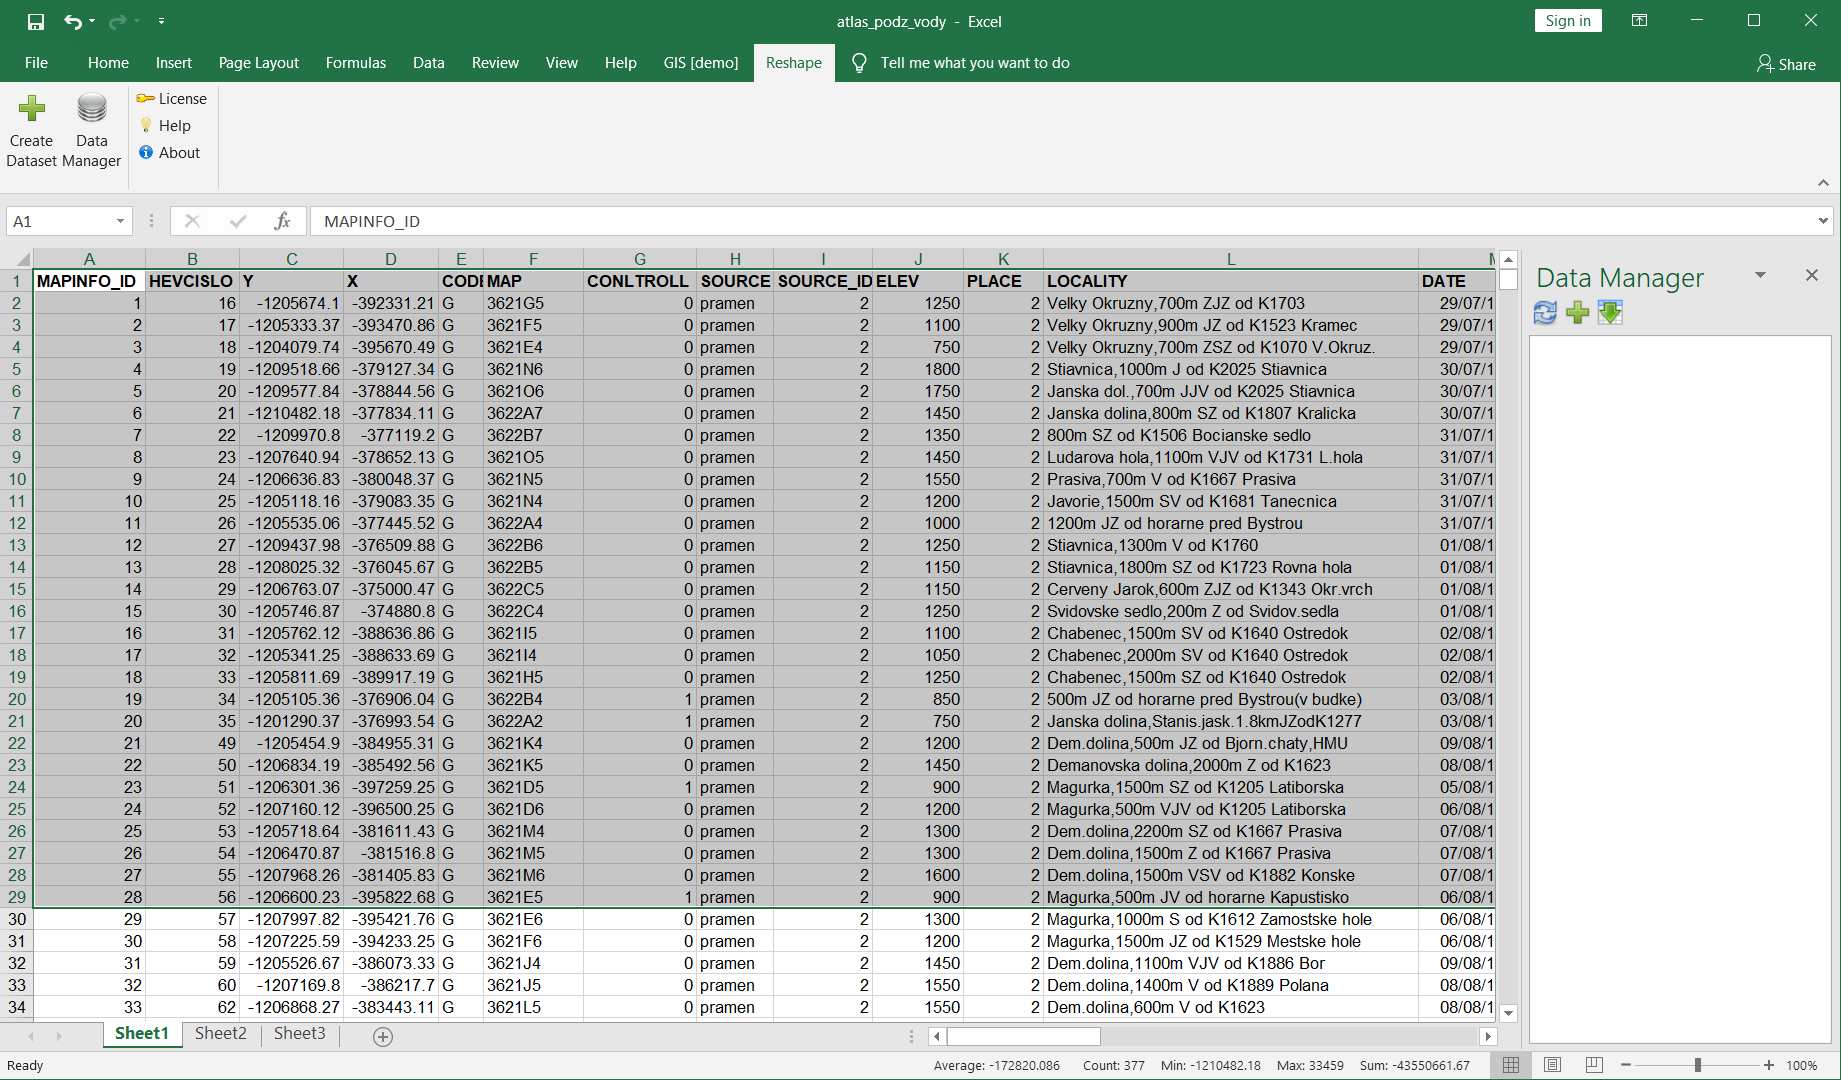
If you have required data selected, press the Create Dataset button in the ribbon toolbar.
Add-in loads your data from the spreadsheet for processing and displays the Create Dataset Dialog. In this dialog you will setup basic dataset properties. In the first row is recorded selected range of spreadsheet cells for processing. In the following example we choose the range A1:M29.
In the next row you define the Dataset Name. Under this name will be your data available inside the add-in framework. This name must be unique for each dataset.
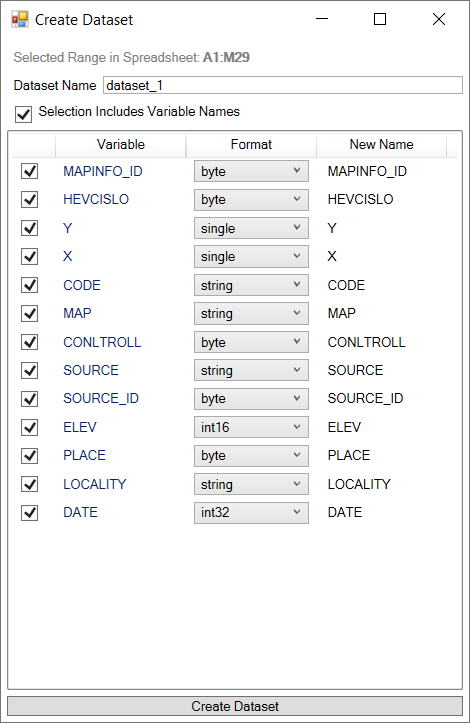
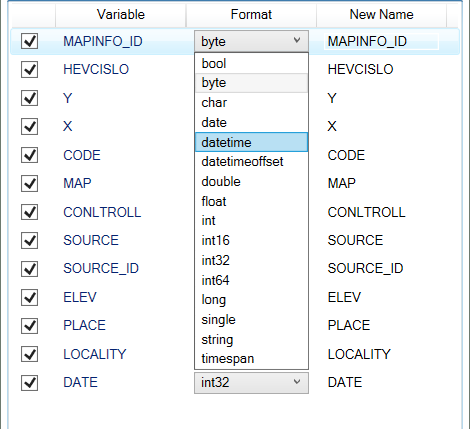
Using the check-box in the third row (Selection Include Variable Names) you can choose whether your spreadsheet selection includes in the first row Variable Names. This property affects detected data types in individual variables. If the Reshape.XL add-in detects several data types in variable the combo-box in the Format column is filled with these data types. If is detected only one type, this data type is selected and from the menu you can choose from other available types. The data type detection is performed on the first and last 50 records.
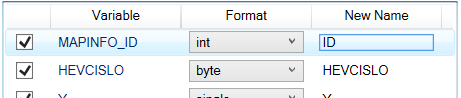
In the first column are check-boxes using which you can choose whether you want to use selected variable in created dataset. Finally, using text-boxes in the last column (New Name) you can change final name of variable in the dataset. Like in the case of dataset names, all variables must have unique name. If you apply identical name for several variables, program automatically modify them using the number postfix (e.g. non-unique VariableX name is modified to VariableX_1).
If you have all the properties defined, press the Create Dataset button. Add-in parses your spreadsheet data and creates a new dataset. About the process finishing you are informed via the message-box. Also the dialog changes its content. After the dataset creation you can review the processing log.
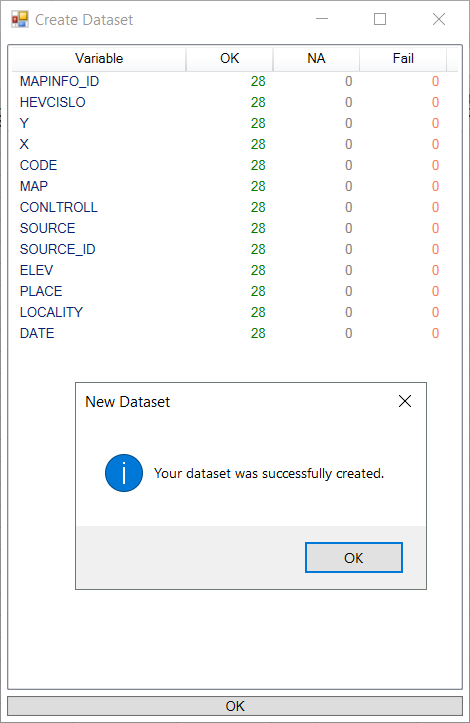
This log consists of a simple table where are listed information about the dataset processing. In rows are listed individual variables. For these variables you can see number of successful data parsing operations (OK), number of empty values per variable (NA) and number of fails during the parsing process (Fail). This table can be hidden by pressing the OK button. Created dataset is finally displayed in the Data Manager Panel.
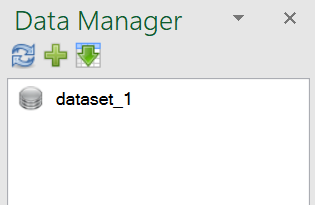
From this panel you can work with created datasets. This list is automatically synchronized across individual Excel windows (Application Level Add-in).
Dataset Manager
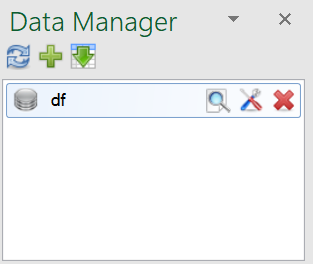
The Dataset Manager is a simple panel for displaying and managing your datasets that were created from your spreadsheet data. This panel is synchronized across individual Excel windows. Dataset Manager Panel you can show (or hide) using the second button in the ribbon toolbar - Data Manager.
Overall, the panel has a very simple structure. It consist of a toolbar with three buttons and list of datasets. Individual datasets are sorted in the order as they were created.
The functionality of three buttons in the toolbar is simple. The first button - Refresh serves for datasets list refreshing. The second button - Create Dataset has the same function as the first button in the ribbon toolbar. The last button you can use if you want to paste processed data (selected dataset in the list) from the add-in back to the Excel spreadsheet. Individual variables and records are inserted from the first selected cell in the active spreadsheet.
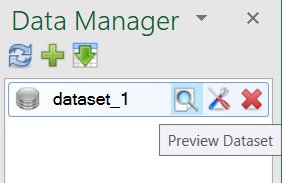
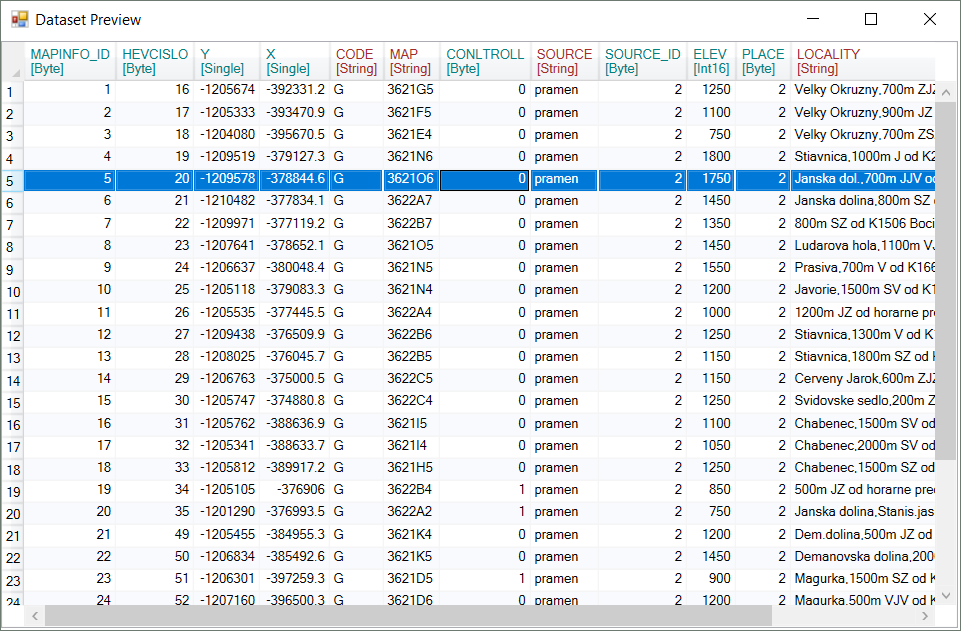
Another functions appears if you click on selected dataset in the list - three buttons after the dataset name. These functions are applied always on the selected dataset. The first button - Preview Dataset displays the data in a simple table. Column header font color is related to the variable data type (visible after the double-click on the table).
The second button (Edit) displays the Reshape.XL window in which you can process the dataset. Using the last button you can Remove selected dataset from the list. Similar functions are hidden also in the contextual menu.
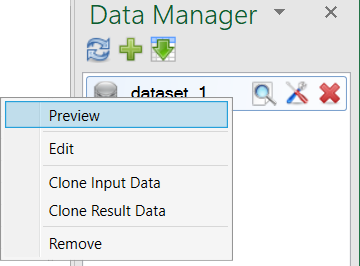
The only exception is functions Clone Input Data and Clone Result Data. Using these functions you can create new dataset based on the existing one. Function Clone Input Data allows you to create dataset that copies the input data. On the contrary, function Clone Result Data creates a new dataset from processed data - data that you prepare using the Reshape.XL window.
Reshape.XL Window
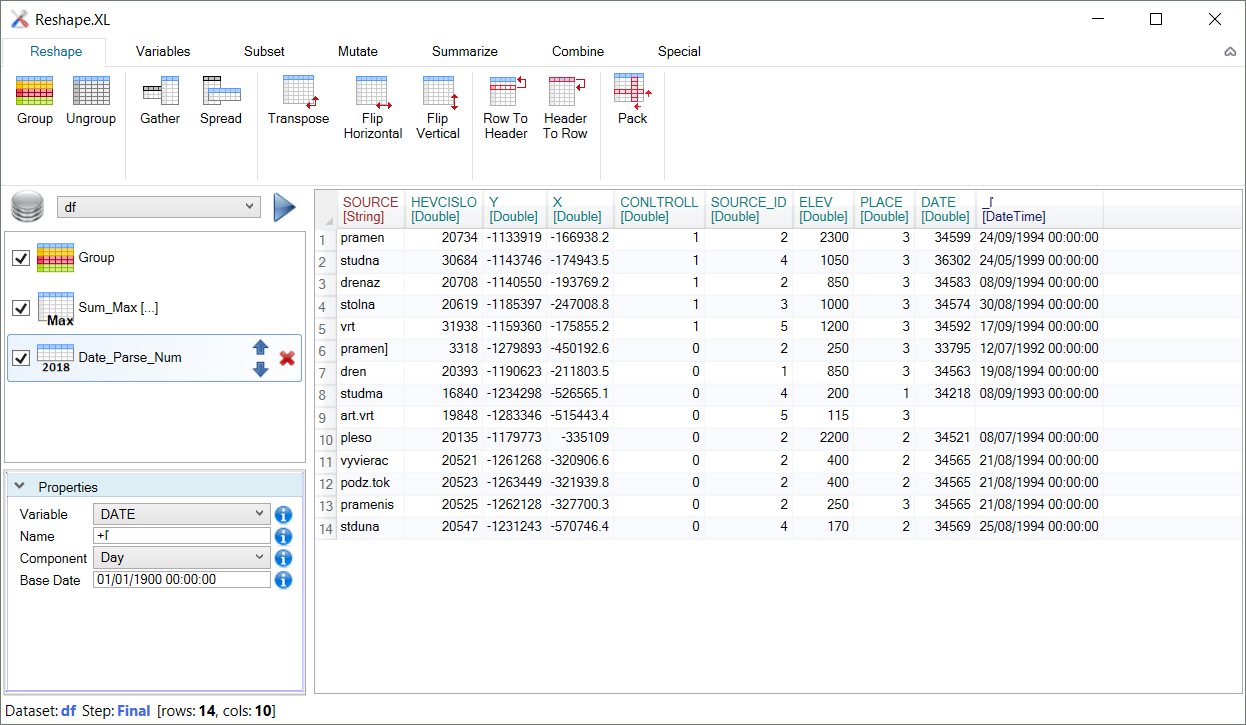
If you want to process your data in the add-in, you will do it in the Reshape.XL window. In this window you will find everything you need for professional data wrangling. Layout of the Reshape.XL window is very clear. Selected dataset is displayed in the Dataset combo-box. Current state of data processing is displayed in the main window area - in the table. Color of variable names in table indicates the data-type.
On the selected dataset you can apply individual functions that are located in the ribbon toolbar. All functions are logically divided into 7 groups - Reshape (basic functions that changes the shape of the dataset), Variables (general-purpose functions focused to individual variables), Subset (functions for records selection), Mutate (create new variable), Summarize (summarize variable), Combine (join datasets together) and Special (set of specialized functions for numeric, string, date and categorical variables).
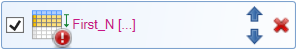
All functions, applied on the dataset, are listed in the list on the right side. This panel has great importance. Your data wrangling steps are proceed through this panel. In the panel you can manipulate with individual processing steps. In the following example you can see processing that consist of 4 steps. Selected dataset was grouped into virtual sub-tables (Group function), then were selected Top N records (First_N), these were arranged (Arrange) and finally was inserted function for records completing (Complete).
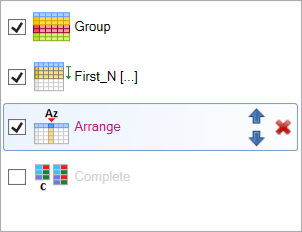
In this example you can see individual processing steps in four states. If the name of function is in black font color, function was successfully processed. Violet font color indicates that the functions is defined, but not computed in the time (or its properties were changed). Finally gray font color means that function will be ignored / skipped in the processing. Individual steps you can disable using the check-box before the function icon. Selected step you can also move up / down in the order of processing and remove using the icons at the end.
In the case, you are using the Group function in processing (creates virtual sub-tables in relation to selected categorical variables), all next function are computed in individual virtual sub-groups. Later you can remove grouping using the Ungroup function. In the case the computation of processing step is affected by grouping, this information is flagged by the “[...]" postfix after the function name. In our example, grouping affects only the First_N function. Function Arrange is not affected by grouping and function Complete is ignored (disabled). Function Group is similar to Group By function in SQL language. The only difference is that it is not applied to summarization functions only, but to all functions that can be used in groups (e.g. subsetting, mutating, …).
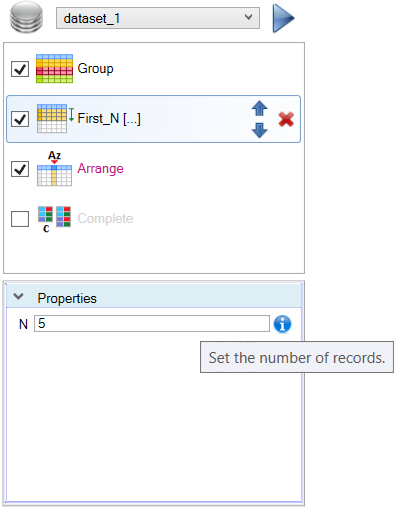
If you select any function in the list, at the bottom part of the panel are displayed its properties. These properties you can set according to your needs. In the following example are displayed properties for the First_N function. Selected function contains only one property - N (number of selected records). If you click on the next processing step, properties panel is automatically refreshed and displays properties of the next selected function.
If an error occurs at the calculation, this information is communicated via a message-box and also is marked in the list of processing steps. Error is marked by the Exclamation Mark Icon.
After finishing all data wrangling steps, the table in main window area contains result data. If you double-click on any processing function, this table displays partial result of the selected step. Add-in stores in memory results of all individual processing steps. What you see in the result table is also indicated in the footer panel. From the following example, we see the table shows results from the second processing step (First_N function) applied on the dataset named dataset_1 and the result contains 23 records and 13 variables.

Since you already know the workflow in the Reshape.XL add-in, you can continue to individual processing functions.