 Complete
Complete a data frame with missing combinations of data. Function turns implicit missing values into explicit missing values.
Properties
| Complete Variables |
Selected variables (columns) in which you want to complete implicit missing values. |
| For Cases |
Selected variables for which (all values combination cases) you want to complete variables defined in “Complete Variables” property. |
Keywords
complete, complete missing values, complete cases, complete categorical cases, implicit missing cases to explicit, complete combination cases for categorical variables, combine, excel, data, spreadsheet
See Also
Drop_NA,
Fill_NA,
Mutate
Video-tutorial
How to Complete Missing Combinations of Categorical Variables
Very often if happens that the data we are working with does not include all possible cases in categorical variables. Imagine that we have measurements for categories of gender and age groups. In these data can be omitted some combinations of described categories. These are the so-called implicit missing values. If you want to display a bar chart from the data, we don’t see the missing category. Consequently, it is more difficult to compare measured values for individual age categories if we draw two identical plots for men and women.
Therefore, we need to have all categorical combinations in the input data. This process is called the transformation of implicit missing values to explicit missing values - the missing categories will be included in the data and NULL values will be used as the input within the measured variable.
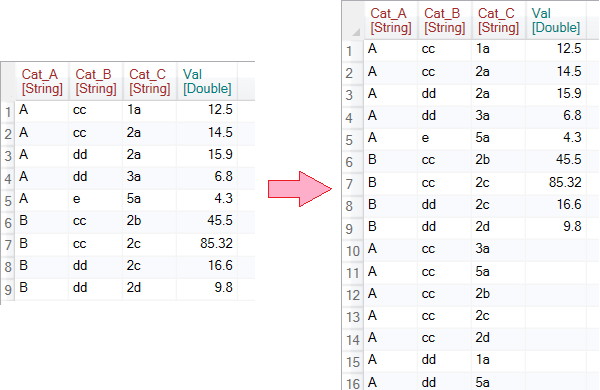
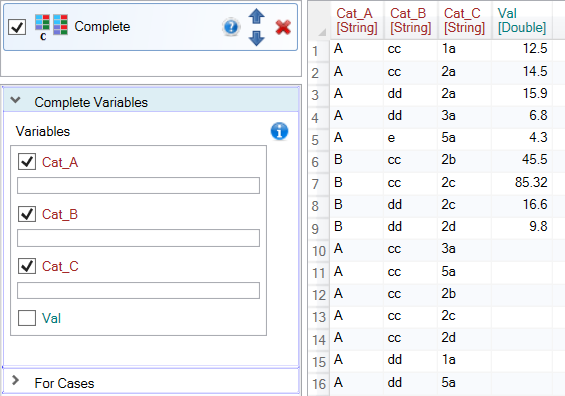
For this purpose you can use the Complete function within the Reshape.XL add-in. An example of using this function is in the following figure. In this example, we used the Complete function to add any missing combination of the Cat_A, Cat_B and Cat_C categorical variables to the dataset. The measured variable Val remained empty.
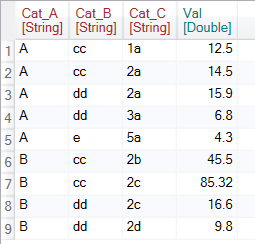
In the following examples we will use a very simple sample dataset, shown in the following figure. The dataset contains three categorical variables Cat_A, Cat_B, Cat_C and one measure variable - Val. Our task will be to complete the missing values within categorical variables in various ways. The Complete function contains only two basic settings - parameters, but with them we can achieve diverse results.
You can apply the Complete function to the dataset by clicking the Complete button in the ribbon toolbar tab Variables.

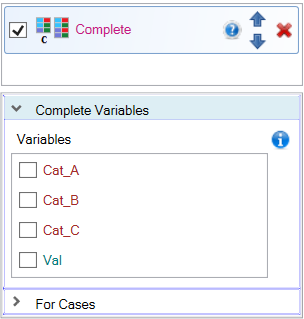
Then we can work with the function. If you click on the function at the top of the side panel at the bottom, the setting options are displayed. Overall, we can define two main parameters - Complete Variables and For Cases. Within these parameters you can select individual variables from the input dataset. Their use will be described in the following text.
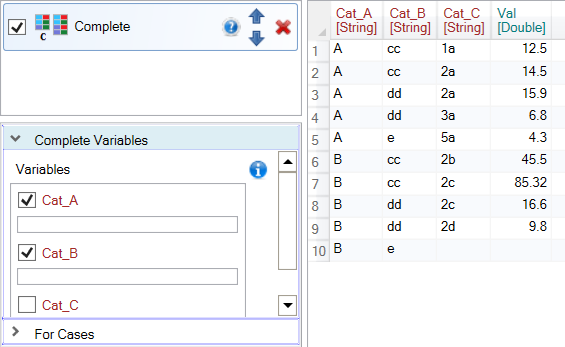
In the first example, we want to add the missing combinations of existing categorical variables Cat_A and Cat_B. To do this, click on the Cat_A and Cat_B checkboxes in the Complete Variables list and set them to TRUE. After clicking on the check-box, a text-box appears under each variable in which you define additional auxiliary parameters that will be described later.
A defined setting (variables Cat_A and Cat_B set to True) causes that the program selects all unique values for the selected categorical variables. Then, in the input table, the add-in checks if all of their combinations occur. If the selected combination is not found, it will be added to the end of the table. In this case, the program adds a combination of categorical values “B” (Cat_A) and “e” (Cat_B) to the table. The rest of the variables in the row remain empty (Cat_C and Val).
In the second example, we look for missing combinations of three categorical variables - Cat_A, Cat_B and Cat_C. Set the selected variables to TRUE in the Complete Variables property. The program then looks in the input table for all combinations of three variables and adds the missing ones at the end of the table. In the described example, dozens of new rows were added to the table. Other (unused) variables will remain empty in new rows (Val in our example).
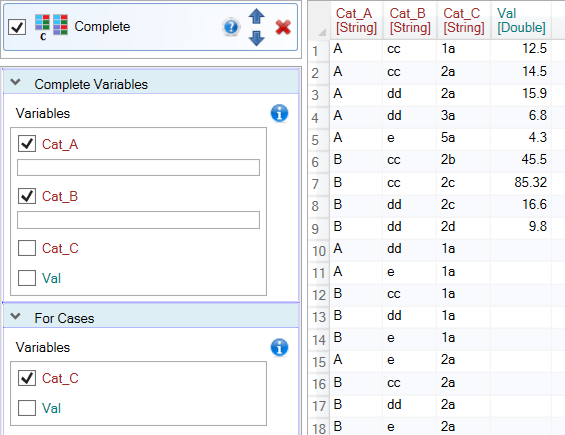
The next example shows another example where we use the For Cases property.This variable has a different meaning. The example shown in the following figure can be defined as follows: for all existing unique values in the Cat_C (For Cases panel) variable, add all combinations of Cat_A and Cat_B (Complete Variables panel).
The result is shown in the following figure. The program for individual existing cases in Cat_C variable (e.g. 1a, 2a, …) completes missing combinations of Cat_A and Cat_B variables. It is not easy to achieve such a result within the basic functionality of Excel.
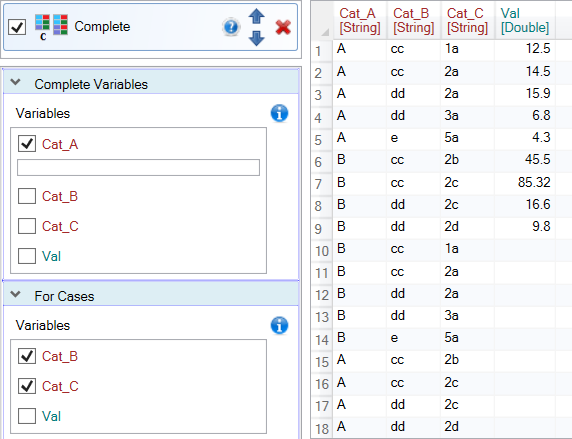
The following example also shows how to use the For Cases property. This time we want to add nonexistent values from the Cat_A variable for all existing combinations of values in Cat_B and Cat_C (For Cases panel). The result is shown in the following figure. For example, in the table we see as the first added row an existing combination of Cat_B and Cat_C (values “cc” and “a1”) with a nonexisting value of Cat_A (value “B”).
So far, we have only added missing values from existing data using their combination. However, sometimes we need to add values in categorical variables that are not available in the input table. For this purpose we use the text-box displayed under each selected variable.
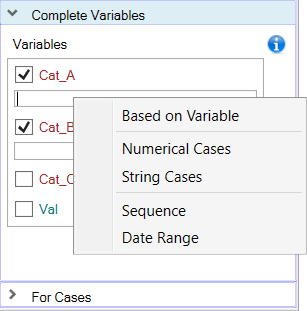
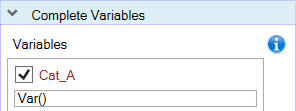
If you right-click on the text-box, the contextual menu is displayed as in the previous figure. Using the items in this menu, you can add other values that do not appear in the dataset. If you click on the first item in the text-box, the “Var()” function will be displayed. This function says that we complete variables only using existing values in the input table. This setting is also active if the text-box is left blank.
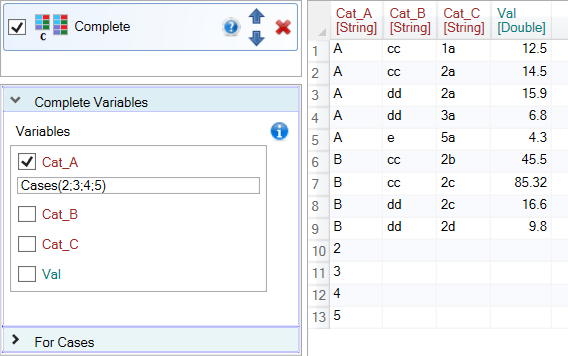
If you click on the second item from the context menu - Numerical Cases, another function is inserted into the text-box - “Cases(2; 3; 4; 5)”. With this function, you can manually enter values for a variable that does not appear in the dataset. Missing values are written in brackets and separated by a semicolon. After clicking the Run button, the values from the Cases function are searched in the input table. If they are not found, they are automatically added at the end of the table.
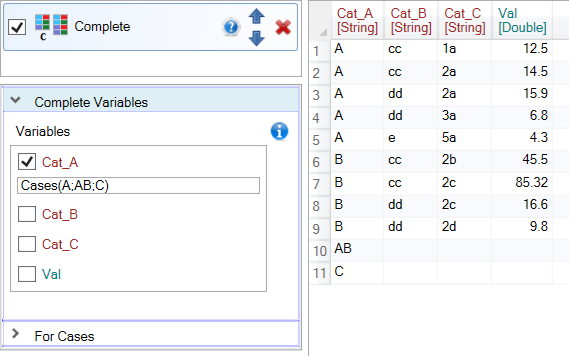
You can add not only numeric variables but basically any data types. If you click on the third item of the context menu - String Cases, the same Cases function is displayed in the text box with sample values of String type. An example is shown in the following figure, where we added the values “A”, “AB” and “C”. As a result, the values “AB” and “C” are added because the “A” value already exists in the input dataset.
In this way, you can add any data type of values using the Cases function. However, it is necessary to be careful not to add, for example, a text value to the numeric column. In this case, the program stops the execution with an error.
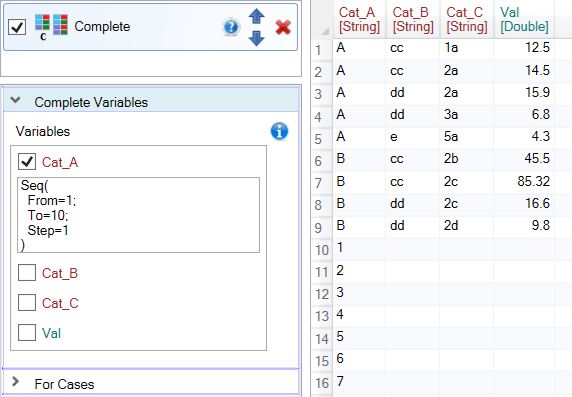
Sometimes we need to add numerical values from a wider range and their definition using the Cases function would not be effective. In this case, click on Sequence item in the context menu of the text-box. The Seq function is inserted into the text-box to define a sequence of numeric values. The function contains three arguments - From, To and Step. The From and To parameters define the range in which the values will be generated. The Step parameter defines the step at which the values will be generated.
In the following example, we generated a sequence of ten values ranging from 1 to 10 with step 1. This sequence is then searched for in the input table and the missing values are added at the end of the table.
Another type of values that do not exist in the dataset and can be automatically added are values in DateTime format. For a small number of values you can use the Cases function. If you need to check more, you can use the DateRange function. Its sample is inserted when you click on the Date Range item in the text-box context menu.
An example of the function appears in the text-box. In parentheses you can define auxiliary parameters, by which the DateTime sequence will be generated. The From and To parameters define the beginning and end of the sequence. The Step parameter defines the type of time step. In the example, Day is used. In addition, you can also use Year, Month, Hour, Minute and Second. Finally, the Value remains, which determines the step value in the time sequence. The function in the following example will generate a time sequence from 5 to 15 August 2019 with a 1 day step.
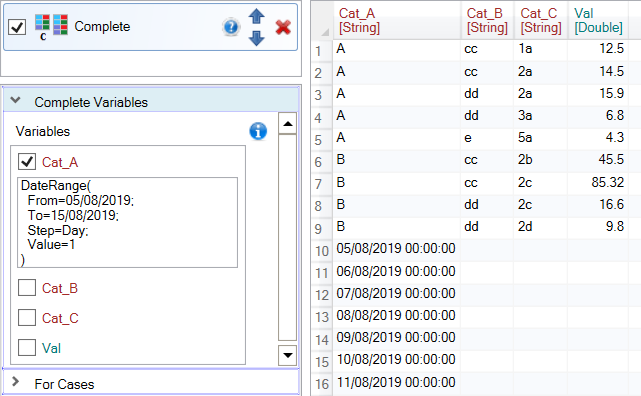
Subsequently, the values from the time sequence are checked against the existing values. Since the variable does not contain any dates, all values from sequence were inserted in the resulting table. This setting has practical use if you need to complete the time series of measurements with a predefined measurement step.
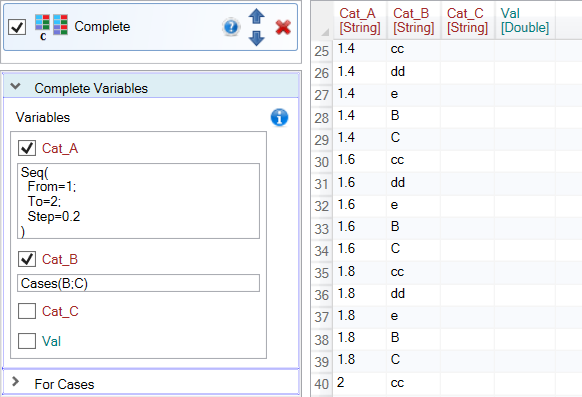
Finally, the last example shows a more complex use of the Complete function. In this case, the algorithm looks for nonexistent combinations of Cat_A and Cat_B variables. In addition to the existing values, numerical values from the sequence were also added to the Cat_A variable (from 1 to 2 with step of 0.2) and two nonexistent values to the Cat_B variable (“B” and “C”). After adding the described values all their combinations were generated and combinations that did not appear in the input dataset were added to the end of the table.
The Complete feature is not simple, compared to other Reshape.XL add-in functions. On the other hand, it provides a wide range of complementing combinations of categorical variables or missing individual values and sequences of Numeric and DateTime values.
You will appreciate its functionality if you need to transform implicit missing values to explicit. You can achieve similar functionality in Excel only by using advanced formulas or another third party tool. With the Reshape.XL add-in, you have this functionality ready for use when needed.